Figure 6.
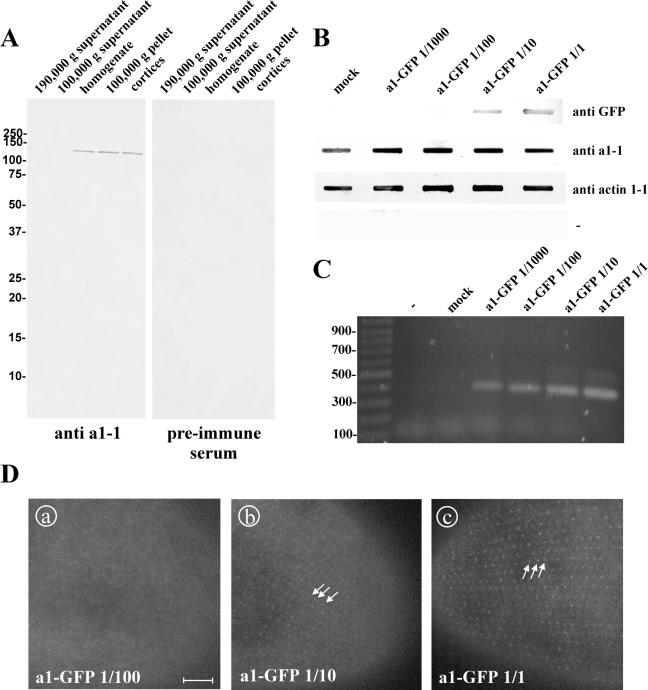
Assessment of the degree of expression of a1-GFP by the transformation of Paramecium cells in a dilution series. (A) characterization of the antibody directed against a1-1(P178-S328) in a Western blot of Paramecium cell fractions. Paramecia were homogenized and separated into a soluble and an isoluble fraction by centrifugation at 100,000 or 190,000 × g. “Cortices” were obtained by rupturing cells followed by washing, so that the cytoplasm is lost and only the insoluble structures of the cell cortex are retained. Fifty micrograms of protein was loaded per lane. A band of ∼120 kDa is visible in cell homogenate, 100,000 × g pellet, in cortices, and, very faintly, in 100,000 × g supernatant with the affinity-purified anti a1-1 antibody, whereas none is visible either in 190,000 × g pellet or when the preimmune serum was used. This is in accordance with the molecular characteristics of a1-1 as a transmembrane protein that is enriched in the cell cortex. (B) Slot-blot to estimate the degree of overexpression of a1-GFP. Cell lysates from clones injected with either a1-GFP at ∼5 μg/μl, 1/10, 1/100, 1/1000 dilutions thereof or the mock control were transferred on nitrocellulose membrane and probed with different antibodies. A monoclonal anti-GFP antibody was used to detect GFP, the anti a1-1(P178-S328) antibody was used to detect endogenous a1-1 and recombinant a1-GFP. Anti actin1-1 antiserum (described in Kissmehl et al. 2004) was used as loading control. To exclude cross reactivity of the secondary antibody with Paramecium proteins a control without a primary antibody was included (-). (C) PCR to confirm the successful transformation of the clones with a1-GFP. (D) GFP fluorescence of clones transformed with a1-GFP at a concentration of 5 μg/μl, 1/10 and 1/100 dilution. Using 5 μg/μl (D, c) or the 1/10 dilution (D, b), the pointed cortical pattern is visible (arrows), whereas no GFP fluorescence could be detected with the 1/100 (D, a) or 1/1000 dilution (our unpublished data). Note that the labeled structures are the same with 5 μg/μl and the 1/10 dilution, so the targeting of the GFP fusion protein is not dependent of the transformation degree. Bar, 10 μm.

