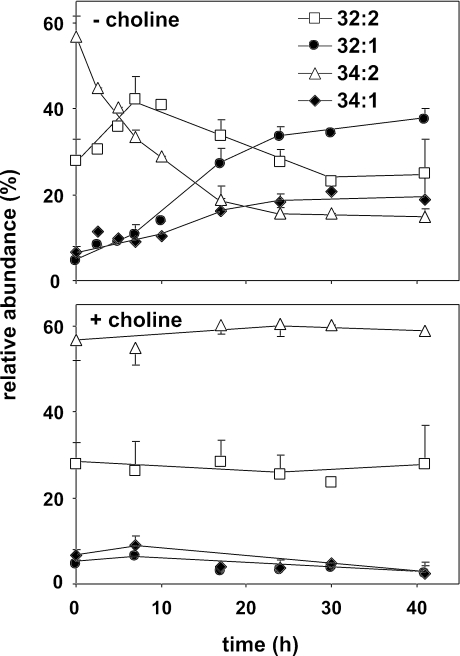
Figure 8.
PC depletion in cho2opi3 cells is accompanied by shortening and increasing saturation of the acyl chains of PE. Experimental conditions were as described in the legend of Figure 5. The PE species composition was analyzed by ESI-MS/MS in the neutral loss mode (m/z 141). The time-dependent changes in the PE acyl chain profile are shown for the four most abundant PE species as percentages of the total PE pool. Under the conditions tested, 32:2, 32:1, 34:2, and 34:1 account for at least 94% of total PE. Data are averaged from three independent experiments; the error bars represent the SD (n ≥ 3).

