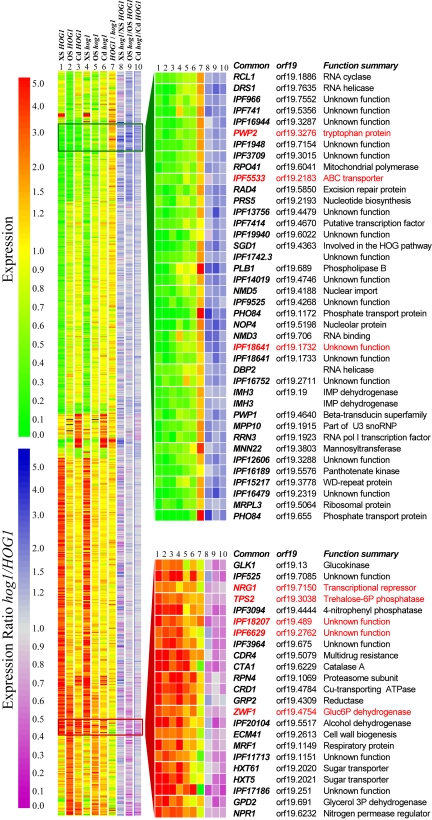
Figure 1.
The global transcriptional response to stress in C. albicans highlights core stress genes. C. albicans genes were clustered on the basis of their expression patterns: left panel, stress-regulated genes; right panel, core stress genes. Expression ratios are indicated by the upper scale bar (red, up-regulation; green, down-regulation): (1) oxidative stress-treated versus untreated HOG1 cells (JC52); (2) osmotic stress-treated versus untreated HOG1 cells; (3) cadmium-treated versus untreated HOG1 cells; (4) oxidative stress-treated versus untreated hog1 cells (JC50); (5) osmotic stress-treated versus untreated hog1 cells; (6) cadmium-treated versus untreated hog1 cells; (7) untreated HOG1 versus untreated hog1 cells. Gene names are provided for core stress genes, with those that did not match the required statistical significance (using SAM) displayed in red. The influence of Hog1 on these expression patterns was estimated by dividing the fold regulation for a particular gene under a particular condition in hog1 cells by the corresponding fold-regulation in HOG1 cells. Calculated hog1/HOG1 ratios are indicated by the lower scale bar (blue, higher expression levels in hog1 cells; purple, lower expression levels in hog1 cells): (8) oxidative stress; (9) osmotic stress; and (10) cadmium stress.

