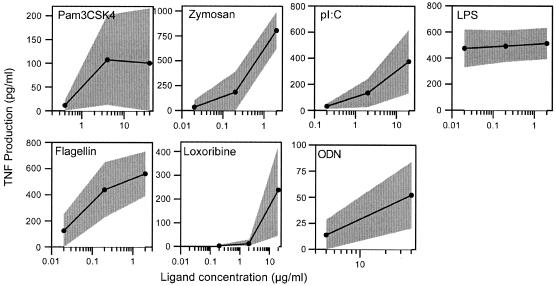
FIG. 3.
TLR responses for control donors. A normal range for TLR ligand-induced TNF production was established by a 24-h incubation of PBMCs in varying concentrations of seven different TLR ligands. Individual points on black lines are means obtained for 20 healthy adult males and females. The gray regions surrounding the black lines represent standard deviations.

