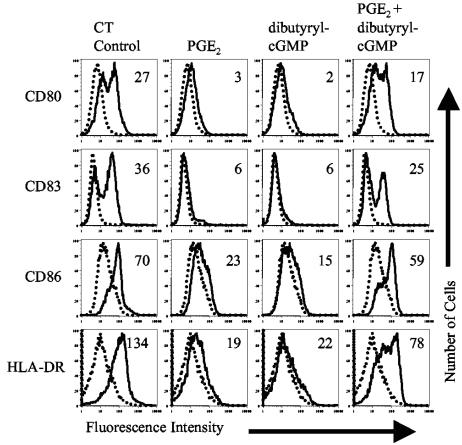
FIG. 6.
Synergy between PGE2 and dibutyryl-cGMP. Cell surface expression of the indicated markers on untreated MDDC (dotted histograms) or MDDC treated with the indicated agonist (solid histograms) is shown. MDDC were incubated with 1 μg/ml of CT (as a control) or 1 μM PGE2 or 250 μM dibutyryl-cGMP alone or together for 20 h. The cells were then harvested and stained for four-color flow cytometry with PE-labeled anti-CD80, FITC-labeled anti-CD83, Cy-Chrome-labeled anti-CD86, and APC-labeled anti-HLA-DR. Numbers in histograms indicate the increase in mean fluorescence of treated MDDC over untreated MDDC. Data are representative of one experiment of three performed with similar results on MDDC derived from different donors.

