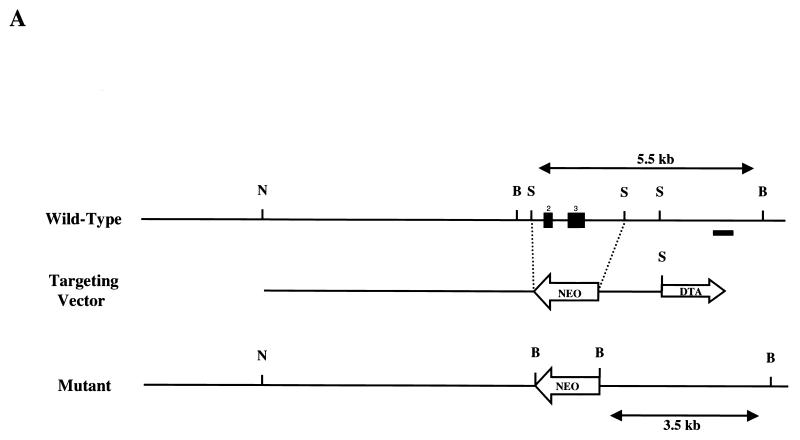
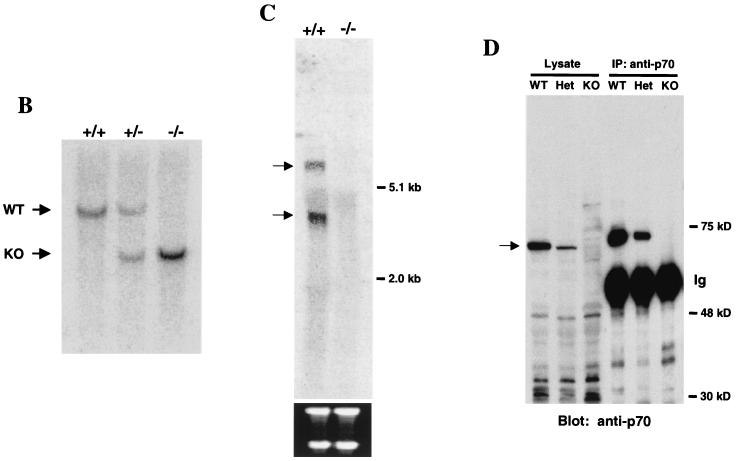
FIG. 5.
p70 targeting. (A) Structure of the p70 targeting construct. The two filled boxes represent putative exons 2 and 3. NheI (N), BamHI (B), and SphI (S) sites are indicated, as is the location of the probe utilized in Southern analysis to distinguish wild-type and targeted alleles (black bar). Neo, neomycin resistance cassette; DTA, diphtheria toxin cassette. (B) Southern blot of BamHI-digested genomic DNA from +/+, +/−, and −/− mice probed with the external probe illustrated in Fig. 4A. Bands generated by the wild-type (+/+), heterozygote (+/−), and targeted (−/−) alleles are indicated. WT, wild type; KO, knockout. (C) Northern analysis of RNA isolated from wild-type (+/+) or p70-deficient (−/−) thymi. The blot was probed with a p70 cDNA probe that was 3′ to the targeted exons as indicated in Materials and Methods. The bottom panel indicates the 28S and 18S RNAs as loading controls. (D) Immunoprecipitation (IP)/Western blot analysis of levels of p70 protein in splenic lysates prepared from +/+ (WT), +/− (Het), and −/− (KO) littermates.


