
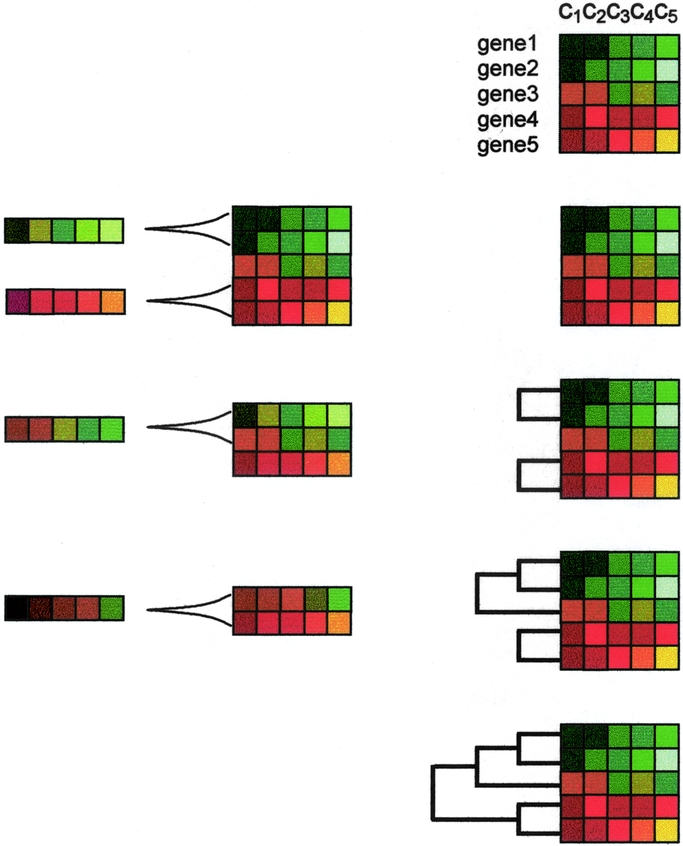
FIGURE 4. Hierarchical aggregative clustering. Using dedicated software, fluorescence ratios (see Fig. 1) are translated into color codes. Consequently, genes with unchanged expression levels are colored as black, whereas those with increasingly positive or negative expression are colored with increasingly intense red or green, respectively. Accordingly, the darker the color, the closer to unchanged expression. The figure shows an example with the color-coded expression values of 5 genes in 5 different experimental conditions (c1, c2, c3, c4, c5). In the aggregative method, the closest pair of profiles is chosen based on a given metric. Then, an average of both profiles is constructed. This defines a relationship of closeness between both profiles that remain tied by the corresponding branch of the tree. Thus, the linked profiles are substituted by the average profile, and the process continues until all the profiles are linked. The linkage relationship defines the hierarchy of the tree.