
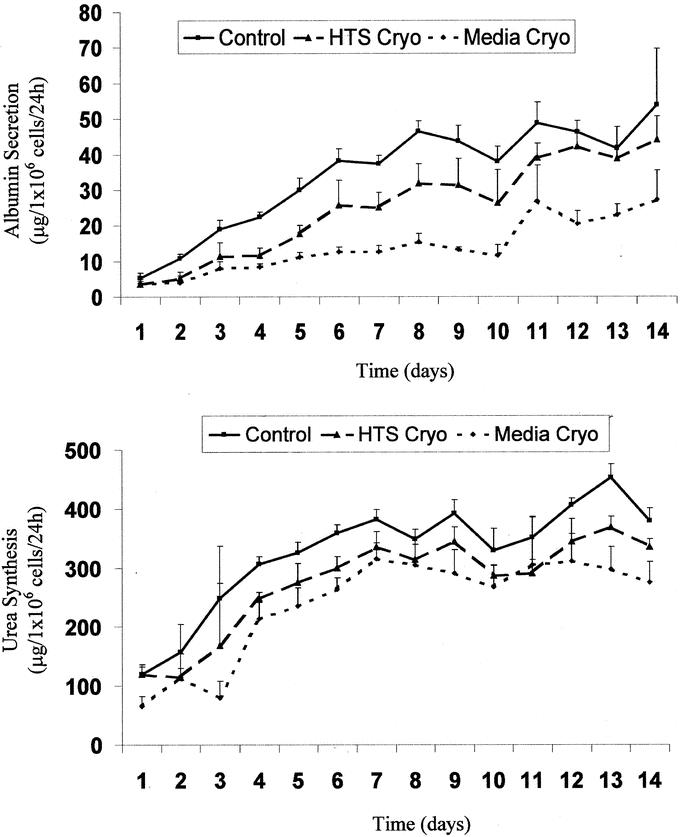
FIGURE 4. Levels of albumin secretion and urea synthesis of hepatocytes following cryopreservation. Figures represent typical graphical data obtained for (A) albumin secretion and (B) urea synthesis from experimental analysis. Analysis was repeated for 3 separate experiments and is reported in the text and Table 2.