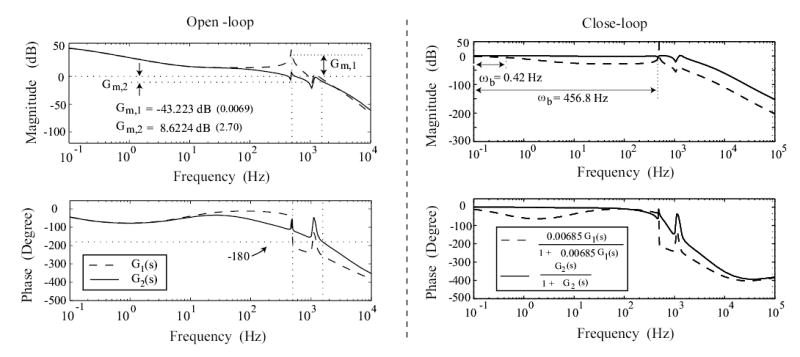
Figure 4.

Bode-Plots: left column shows the open-loop bode-plots of the system without the notch filter (dashed line), and with the notch filter (solid line), where Gm,1 and Gm,2 are the gain-margin of these two cases respectively. Right column shows the closed-loop bode plot of the system without the notch filter (dashed line, KC = 0.00685), and with the notch filter (solid line, KC = 1), where ωb denotes the bandwidth of the corresponding system.
