
Figure 9.
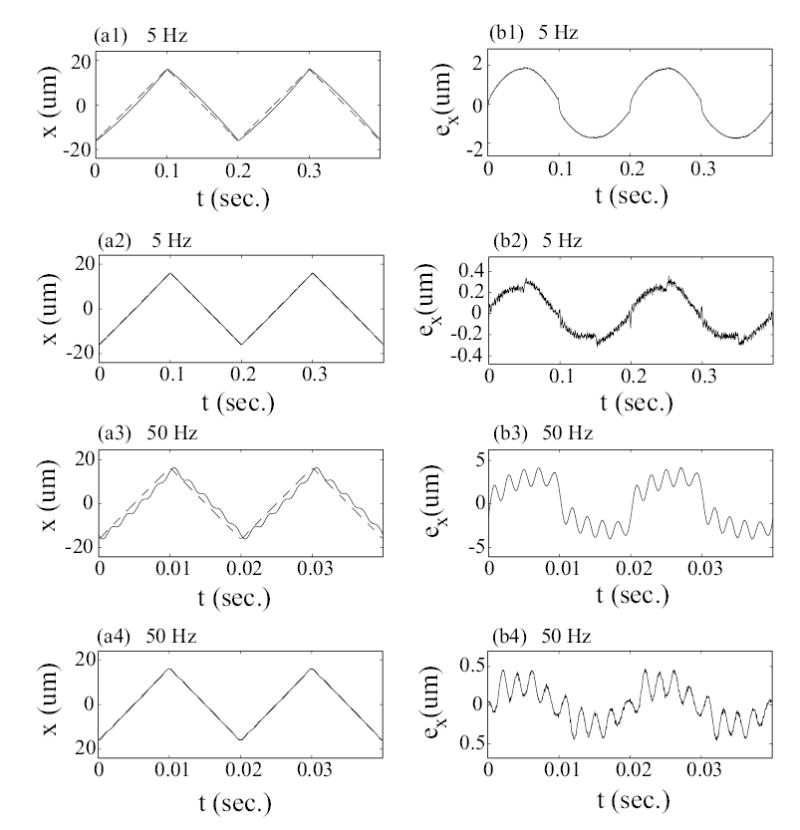
Experimental results for large-range scanning (32 μm). Left column compares the tracking by using the DC-Gain method at scan frequency of 5 Hz (plot (a1)) and 50 Hz (plot (a3)) with the tracking by using the inversion-based approach at scan frequency of 5 Hz (plot (a2)) and 50 Hz (plot (a4)) respectively, where the solid lines is the measured tracking results x(t) and the dashed lines are the optimal desired trajectories xopt(t). Right column shows the corresponding tracking errors.