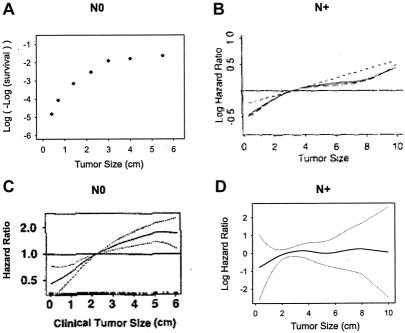
FIGURE 5. Graphs from the literature data showing the similarity of the functional form of tumor size for different outcomes in node-negative (N0) and in node-positive (N+). (A) Cumulative relative-mortality hazard in N0, adapted from Carter.9 (B) Log-hazard ratio of recurrence in N+, reprinted from Gray,10 with permission of the author and the American Statistical Association. (C) Hazard ratio of treatment failure (local, regional, or distant recurrence, or second primary tumor) in N0, reprinted from Bryant,11 with permission of the author and Kluwer Academic Publishers. (D) Log-hazard ratio of recurrence or death in N+. Functional form for tumor size based on the GBSG-2 data, from Willi Sauerbrei.13

An official website of the United States government
Here's how you know
Official websites use .gov
A
.gov website belongs to an official
government organization in the United States.
Secure .gov websites use HTTPS
A lock (
) or https:// means you've safely
connected to the .gov website. Share sensitive
information only on official, secure websites.
