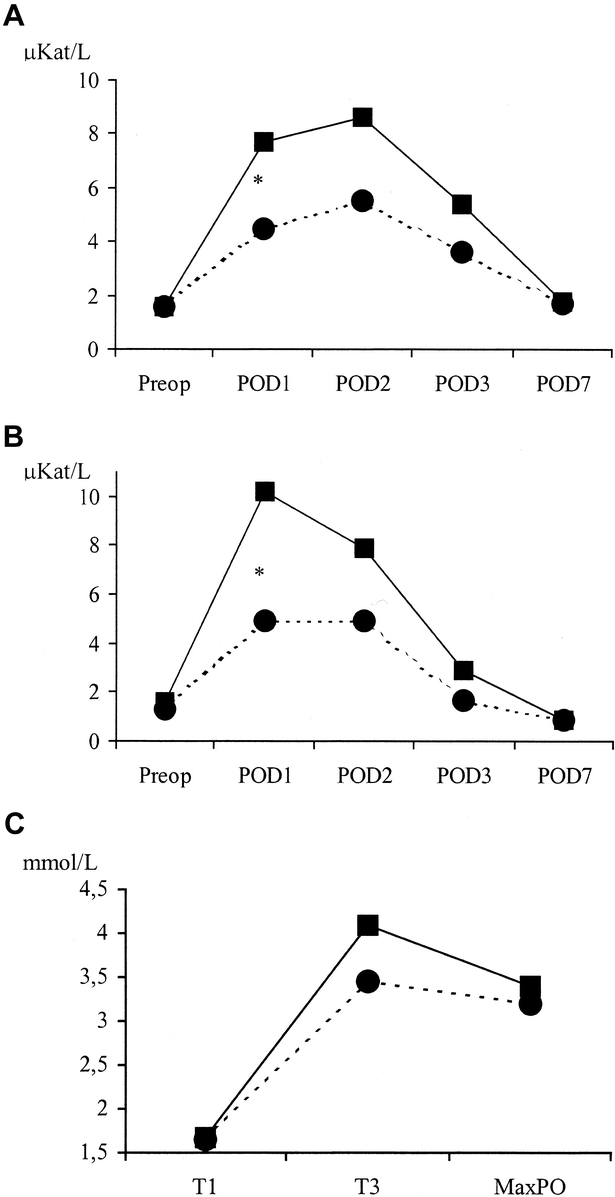
FIGURE 4. Evolution of ischemic injury parameters. A, Postoperative evolution of ALT. (μKat/L). POD, postoperative day.* The levels on postoperative day 1 were significantly higher in the CC group (P = 0.01). ALT normal value <0.9 μkat/L. B, Postoperative evolution of AST (μkat/L). POD, postoperative day.* The levels on postoperative day 1 were significantly higher in the CC group (P = 0.03); normal value <0.6 μkat/L. C, Evolution of lactate levels (mmol/L). T1: basal; T3: 10 minutes after unclamping. MaxPO, maximum value on postoperative period. Normal value <2 mmol/L. ▪, CC group; •, SC group.
