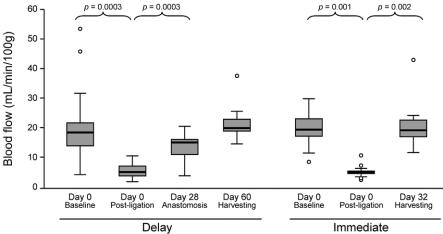
FIGURE 4. Time courses of gastric fundus blood flow in the Delay and Immediate groups. Blood flow was measured by laser Doppler flowmetry. Solid line indicates median blood flow. Shaded boxes indicate interquartile range. Comparisons between baseline and postligation blood flow and between the postligation and next scheduled measurement of blood flow were statistically significant.

An official website of the United States government
Here's how you know
Official websites use .gov
A
.gov website belongs to an official
government organization in the United States.
Secure .gov websites use HTTPS
A lock (
) or https:// means you've safely
connected to the .gov website. Share sensitive
information only on official, secure websites.
