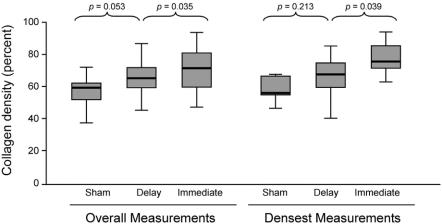
FIGURE 7. Collagen density in the submucosa of the gastric fundus. Using digital colorimetric quantification, measurements of collagen density were taken in 3 representative regions of interest 5 mm distal to the anastomosis. Overall measurements using every measured value in each group are given. When only the highest measurement in each animal was considered, the same trends persisted. A significant difference was noted between the Delay and Immediate groups, and a trend toward significance was noted between the Sham and Delay groups.

An official website of the United States government
Here's how you know
Official websites use .gov
A
.gov website belongs to an official
government organization in the United States.
Secure .gov websites use HTTPS
A lock (
) or https:// means you've safely
connected to the .gov website. Share sensitive
information only on official, secure websites.
