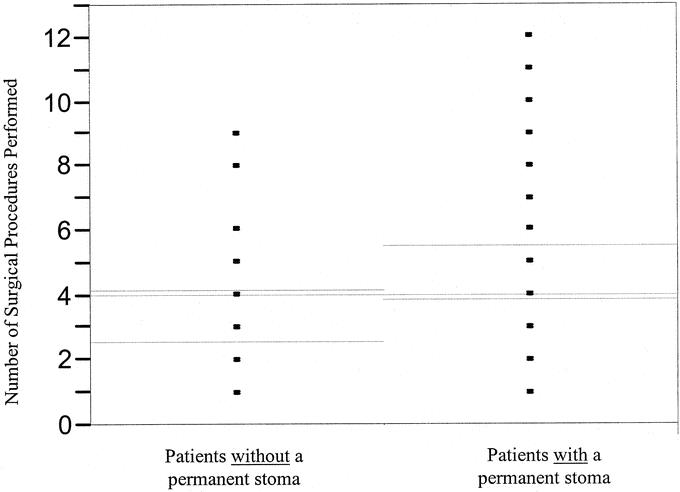
FIGURE 3. Number of surgical procedures performed in patients without a permanent stoma and in patients with a permanent stoma. Comparison using a 2-sample t test. Gray lines indicate overall means; green lines indicate 95% confidence intervals; P = 0.0223.
