
Figure 6.
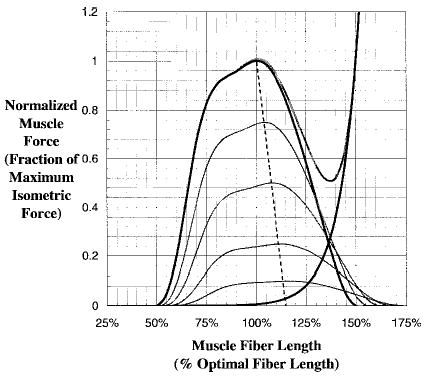
Normalized force-length relationship for muscle. Thick dark lines indicate maximum activation, whereas the light thin lines are lower levels of activation. Note that the optimal fiber length is longer as the activation decreases. In the figure, λ = 0.15, which means the optimal fiber length is 15% longer at zero activation.