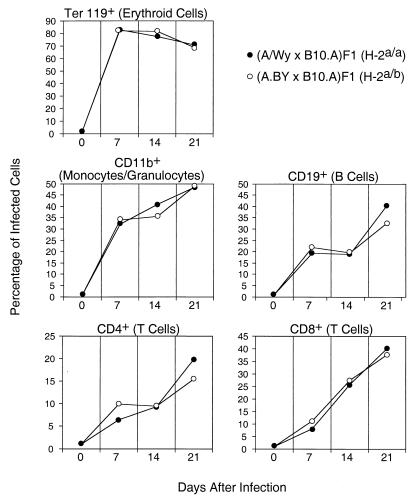
FIG. 2.
FV infection of different spleen cell subpopulations. Shown are mean percentages of spleen cells of the indicated lineage that stained positive for the expression of FV glycosylated Gag antigen using MAb 34 (5) as previously described (11). Analyses were performed using flow cytometry by gating on populations of cells stained positive for lineage-specific markers as previously described (14). Dead cells were excluded from analysis by propidium iodide staining. Five mice per strain per time point were analyzed, and none of the differences between the resistant and susceptible strains were statistically significant, as determined by Student’s t test (all P > 0.05).

