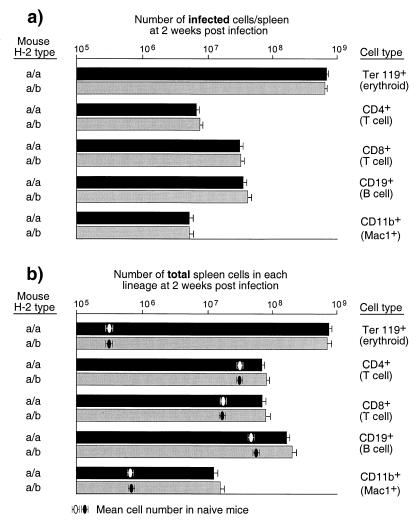
FIG. 3.
FV effects on spleen cell subpopulations. (a) The log10 geometric mean number of infected cells in each splenic subpopulation from H-2a/a susceptible (A/WY × B10.A)F1 mice and from H-2a/b-resistant (A.BY × B10.A)F1 mice was calculated by multiplying the total number of nucleated cells per spleen times the percentage of MAb 34 positive cells of each lineage divided by 100. (b) The log10 geometric mean number of total cells of each subpopulation was calculated by multiplying the total number of nucleated cells per spleen times the percentage of lineage positive cells divided by 100. All mice were infected with 1,500 spleen focus-forming units of FV 14 days prior to analysis. The error bars represent standard errors of the mean. There were no statistical differences between the two mouse strains in either number of infected cells or total cells in each lineage when comparing the log10 geometric means by the Mann-Whitney statistical test (all P > 0.05). Results are from the same mice shown in Fig. 2.

