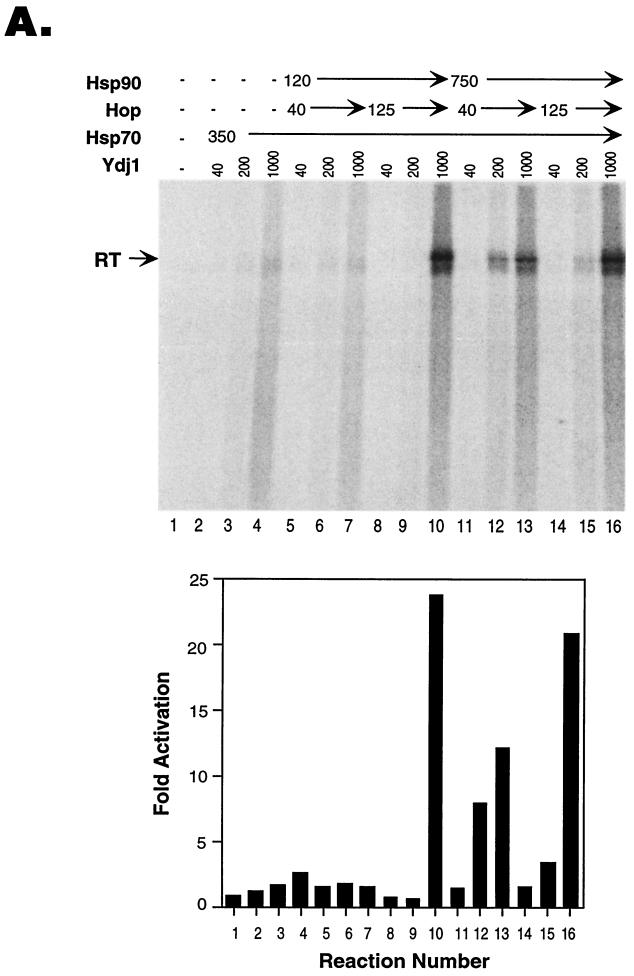
FIG. 2.
Concentration dependence of reconstitution of protein priming. Protein-priming reactions were carried out as for Fig. 1, except that the amounts of the chaperone proteins added to the reactions were varied. (A) The amount of Hsp70 was held constant (350 ng per reaction), and various amounts (in nanograms) of Hsp90, Hop, and Ydj1 were added to the indicated reactions. The graph at the bottom shows the quantitative results (by phospho-imaging) derived from the same reactions shown at the top. The control reaction (reaction 1) signal was set to 1, and the fold activation represents the fold increase in the reaction signal over this background activity. (B) The amounts of Hsp90 and Hop were held constant (at 120 and 125 ng per reaction, respectively), and various amounts (in nanograms) of Ydj1 and Hsp70 were added to the indicated reactions. The graph on the right shows the quantitative results derived from the reactions shown on the left. The control reaction (reaction 7) signal was set to 1.

