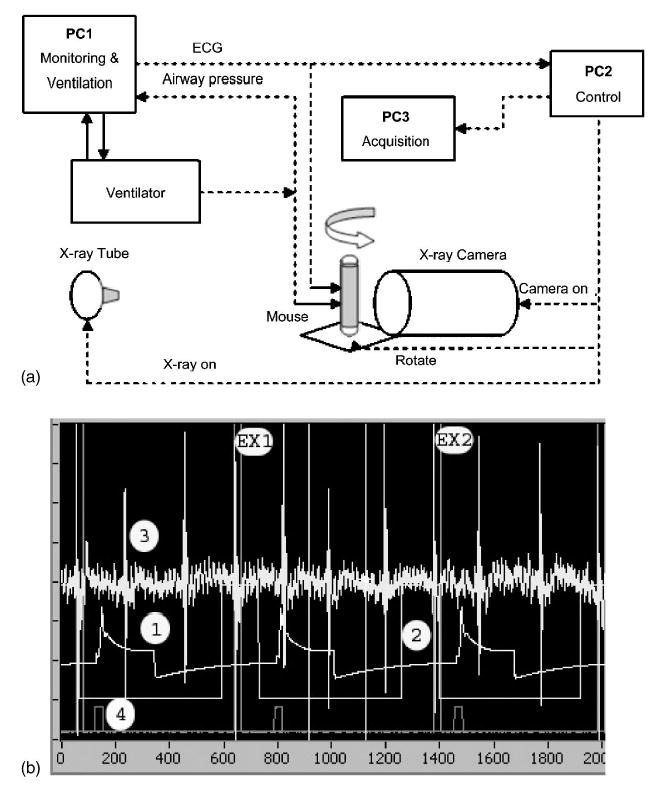
Fig. 3.

A schematic of the system is shown (a) and the signal wave forms during sampling in (b). The system is controlled by three computers each running LABVIEW. PC1 controls the ventilator and monitors the physiologic signals from the animal. PC2 acts as the sequencer for the system. It receives triggers from PC1 that control the x-ray generator and the stepping motor for the gantry. PC3 receives the trigger from PC2 that controls the camera acquisition, integration, and readout. (b) shows a capture of the monitoring application during sampling. Trace 1 shows the pressure at the ventilator. In this example a window is enabled at end expiration (trace 2) which is then logically combined with the ECG (trace 3) to allow exposures 1 and 2 (EX1, EX2). Trace 4 shows the digital signal to advance the table to the next projection.
