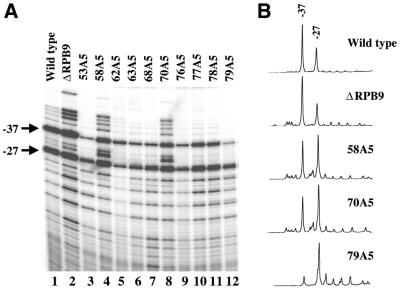
Figure 2.
Transcription start sites of the endogenous ADH1 gene. (A) Shown are primer extension results to determine ADH1 transcription start sites in cells (grown at 30°C) containing the indicated TFIIB mutants. As a control, cells that lack the RNAPII subunit RPB9 were also used in the same analysis. Two major start sites of ADH1, –27 and –37, are marked. (B) Shown are intensity scanning graphs for ADH1 start site usage in cells containing selected mutants.

