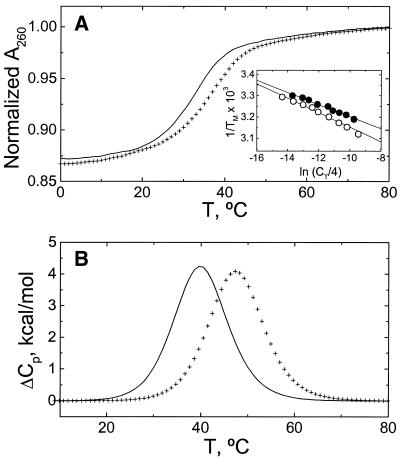
Figure 3.
Thermodynamic characterization of the helix–coil transition of duplexes in 10 mM HEPES buffer, pH 7.5. Line, ‘control’ duplex; crosses, ‘modified’ duplex. (A) Typical UV melting curves at a strand concentration of 25 µM. (Inset) Tm dependence on total strand concentration. Filled circles, ‘control’; open circles, ‘modified’. (B) DSC curves at oligonucleotide strand concentrations of ∼300 µM.

