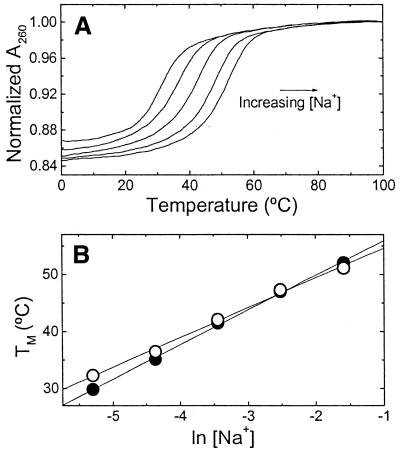
Figure 4.
UV melting curves of oligonucleotides, at a constant strand concentration of 5 µM, as a function of salt concentration in 10 mM HEPES buffer, pH 7.5. (A) Typical melting curves over the NaCl concentration range 5–205 mM. (B) Dependence of Tm on salt concentration. Filled circles, ‘control’; open circles, ‘modified’.

