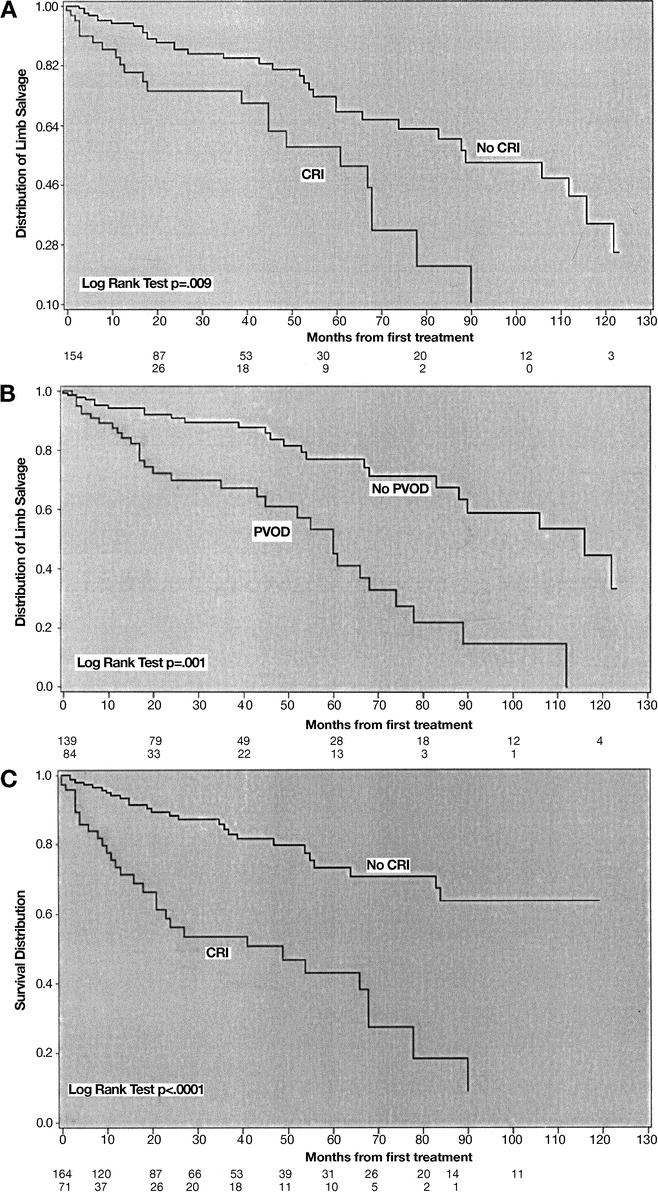
FIGURE 1. A, Kaplan-Meier life plot analysis of CRI and limb salvage. Limb salvage was significantly lower in those patients with CRI as compared with those without CRI (P = 0.009). The bottom numbers are patients at risk at each interval. B, Kaplan-Meier life plot analysis of PVOD and limb salvage. Limb salvage was significantly lower in those patients with PVOD as compared with those without (P = 0.001). The bottom numbers are patients at risk at each interval. C, Mortality was significantly worse in patients with CRI as compared with those without (P < 0.0001).
