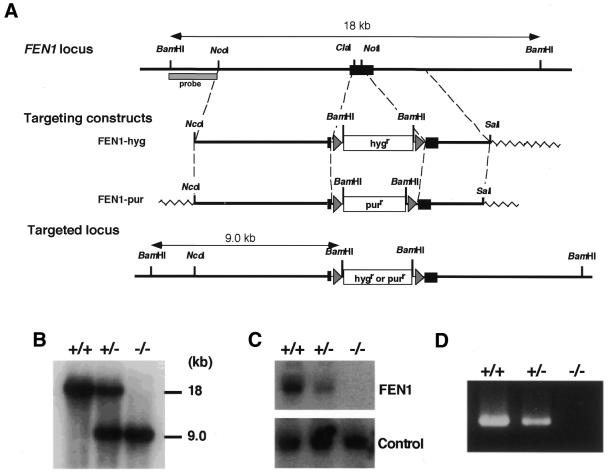
Figure 1.
Generation of chicken FEN1–/– cells. (A) Schematic representation of targeted disruption of the chicken FEN1 gene. The chicken FEN1 locus, the two targeting constructs and the resulting targeted locus are shown. The black box indicates the open reading frame of the FEN1 gene. The triangles flanking the hygromycin-resistance (hygr) or puromycin-resistance (purr) gene designate loxP sequences. The figure is not drawn to scale. (B) Southern blot analysis. BamHI-digested genomic DNA of wild-type (+/+), heterozygous mutant (+/–) and homozygous mutant (–/–) cells was hybridized with the probe shown in (A). (C) Northern blot analysis. Total RNA of wild-type, FEN1+/– and FEN1–/– cells was hybridized with a chicken FEN1 cDNA probe. As a control, the same filter was rehybridized with a chicken Ku70 cDNA probe. (D) RT–PCR analysis. Total RNA of wild-type, FEN1+/– and FEN1–/– cells was used as a template to amplify the full-length FEN1 cDNA.

