Figure 2.
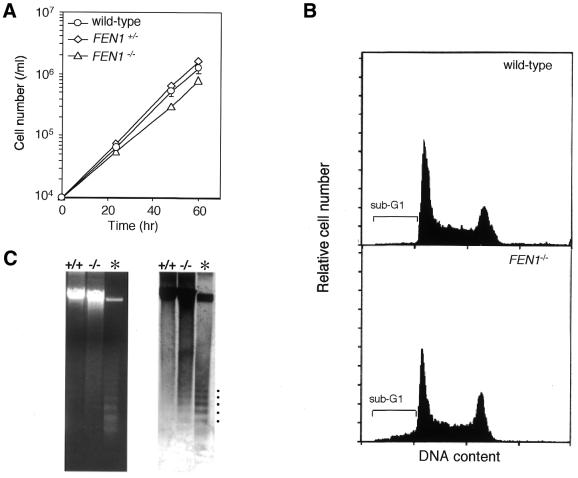
Growth characteristics of FEN1–/– cells. (A) Growth curves of wild-type, FEN1+/– and FEN1–/– cells. Data shown are the means ± SD of four independent experiments. (B) Cell cycle distribution of wild-type and FEN1–/– cells. Asynchronous cell populations in logarithmic growth phase were subjected to flow cytometric analysis. The brackets indicate sub-G1 fractions. Data shown are from one representative of three independent experiments. (C) Agarose gel electrophoresis of genomic DNA isolated from exponentially growing wild-type and FEN1–/– cells. The gel was stained with ethidium bromide (left panel) and then subjected to Southern blotting using DT40 genomic DNA as probe (right panel). For reference (asterisk), apoptotic ladder bands, which occur in genomic DNA from overgrown DT40 cells, are indicated by dots.

