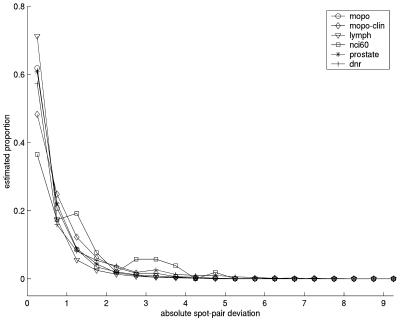
Figure 1.
Plot showing the proportion of observations inside fixed-width intervals of intra-clone spot-pair deviations for the data sets mopo (circles), mopo-clin (diamonds), lymphoma (triangles), nci60 (squares), prostate (asterisks) and dnr (plus symbols). The deviations are based on log base 2 ratios and are calculated from all spots that had not been flagged and contained positive background-corrected spot intensities in both channels. The plot summarizes the information from separate histograms for each data set. The values on the vertical axis give the proportion of the data sets (range 0–1) present in the interval, and the values on the horizontal axis are the midpoints of the intervals. The intervals are 0–0.5, 0.5–1, …, 9.5–10. Values equal to the lower limit of each interval are included. Values equal to the upper limit of each interval are not included.

