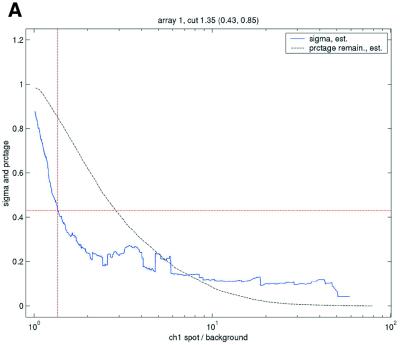
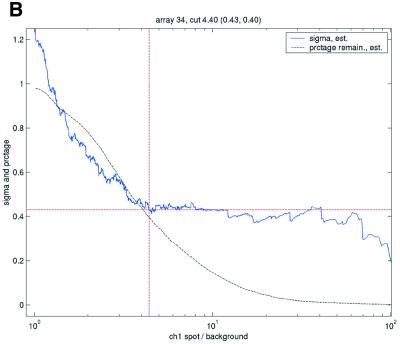
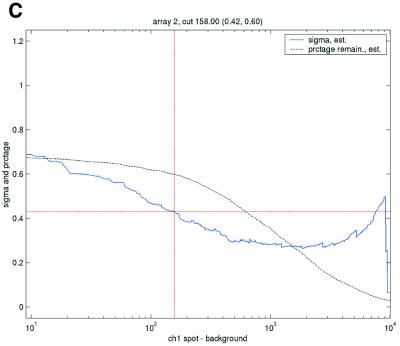
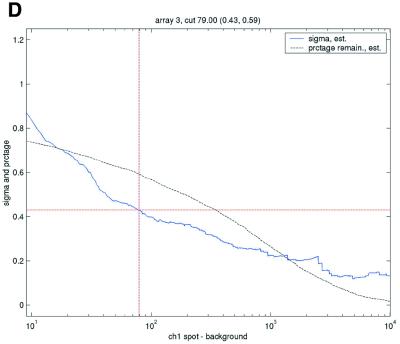
Figure 3.
Filtering thresholds from quality-based filtering. Estimates of the standard deviation,  , in the ANOVA model were obtained from all points strictly to the right of each possible cut-off value on the x-axes (solid lines). To adapt filter cut-off values we sought the smallest x-value giving rise to
  smaller or equal to a target value of 0.43. The vertical dashed lines are placed at the respective thresholds on the x-axes, corresponding to the cut-value shown in the plot-title. The horizontal dashed lines (red) are placed at y = 0.43, corresponding to the σ0 used in the test. The solid (blue, ‘sigma, est.’) lines show the estimated values of sigma for each possible cut-off along the x-axis. The dashed (black, ‘prctage remain., est.’) lines show the estimated percentage of points that would remain when filtering at a given cut-off along the x-axis. Plots are shown for channel 1 data from arrays 1 and 34 in the Lymphoma data set. In this data set, array 1 was one of the better arrays in terms of data quality. The desired level of repeatability was attained with a threshold value at 1.28 for the SB ratio (in channel 1), whereas for array 34 the corresponding cut-off was found at 4.40. From the DNR data, channel 1 data for arrays 2 and 3 are shown in plots (C) and (D), respectively. As can be seen from these plots, the estimated cut-off values for filtering was much higher in array 2 than in array 3. (A) Lymphoma, array 1, channel 1, SB ratio. (B) Lymphoma, array 34, channel 1, SB ratio. (C) DNR, array 2, channel 1, SB difference. (D) DNR, array 3, channel 1, SB difference.


