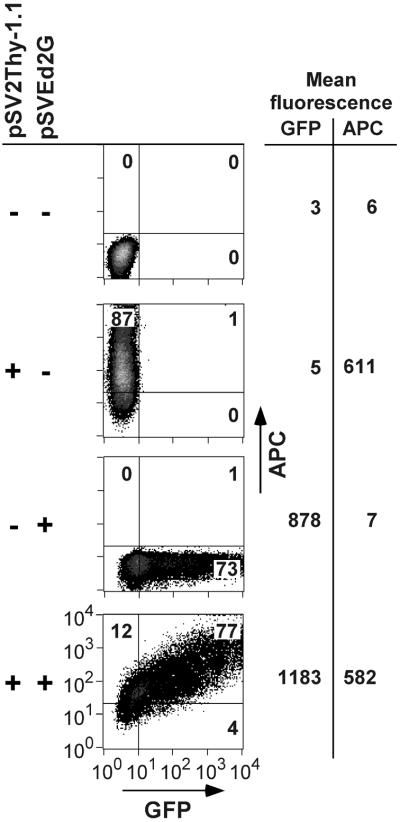
Figure 1.
Two-color flow cytometry analysis of GFP reporter expression. Density plots of phoenix cells transfected with pUC19 alone, pSV2Thy-1.1 alone, pSVEd2G alone, or co-transfected with pSVEd2G and pSV2Thy-1.1. Reporter expression was analyzed 40 h after transfection. GFP fluorescence (x-axis) and Thy-1.1 surface expression, detected by an APC-labeled anti-Thy-1 antibody (y-axis), were analyzed by two-color flow cytometry. The numbers in the quadrants indicate the percentages of viable cells expressing pSV2Thy-1.1 alone, pSVEd2G alone, or pSVEd2G and Thy-1.1. The mean GFP and APC fluorescence intensities (arbitrary units) of the entire cell populations are indicated on the right.

