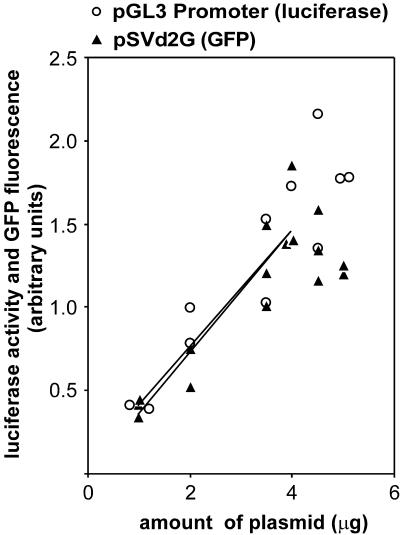
Figure 2.
Comparison of GFP-Thy-1.1 and luciferase-renilla reporter systems. HT1080 were transfected with 1–5 µg of pSVd2G (GFP) and 1 µg of pSV2Thy-1.1 or with 1–5 µg of pGL3 Promoter (luciferase) and 0.3 µg of pRL-SV40. The expression of pSVd2G and of pGL3 Promoter reporters (F), normalized to that of their respective control plasmids (pSV2Thy-1.1 and pRL-SV40) is plotted against the amount of plasmid (A) used for transfection. The following regression lines and correlation coefficients were obtained when between 1 and 4 µg pSVd2G or pGL3 Promoter were transfected: F = 0.037A + 0.0022 (R2 = 0.84) for pSVd2G and F = 0.036A + 0.0049 (R2 = 0.74) for pGL3 Promoter.

