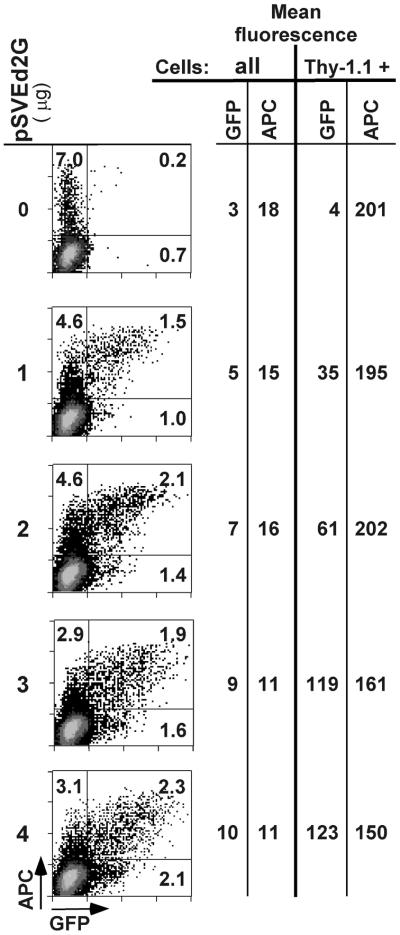
Figure 3.
Analysis of normal human lung fibroblasts that cannot be transfected with high efficiency. 50 000 to 100 000 cells of each sample were passed through the flow cytometer. The horizontal line separates the Thy-1.1-expressing cells from the negative cells. The numbers in the quadrants indicate the percentages of viable cells expressing Thy-1.1 alone (upper left quadrant), pSVEd2G alone (lower right quadrant) or pSVEd2G and Thy-1.1 (upper right quadrant). The mean GFP and APC fluorescence intensities of the entire populations (all) and of the Thy-1.1-expressing (Thy-1.1 +) cells are indicated on the right.

