
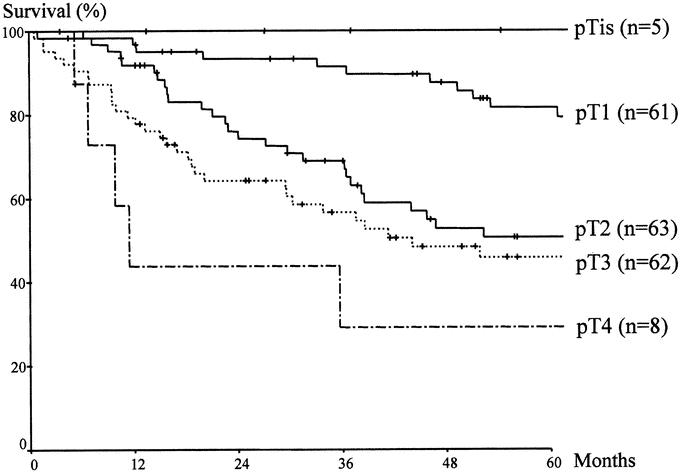
FIGURE 3. Comparison of survival according to the depth of invasion. Significant differences were found between early ampullary cancers (pTis, pT1) and other T stage cancers (pT2, pT3, pT4) (P < 0.001).
Official websites use .gov
A
.gov website belongs to an official
government organization in the United States.
Secure .gov websites use HTTPS
A lock (
) or https:// means you've safely
connected to the .gov website. Share sensitive
information only on official, secure websites.
FIGURE 3. Comparison of survival according to the depth of invasion. Significant differences were found between early ampullary cancers (pTis, pT1) and other T stage cancers (pT2, pT3, pT4) (P < 0.001).