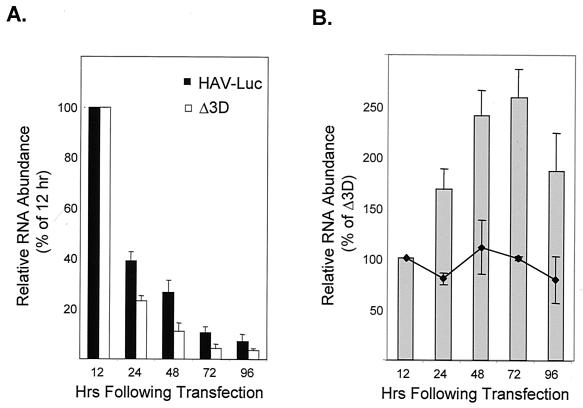
FIG. 3.
Quantitative analysis of dot blot hybridization assays for cell-associated HAV RNA following transfection of Huh-7 cells with replicon RNA. (A) Relative abundance of HAV-Luc and HAV-LucΔ3D RNA in transfected cells. PhosphorImager values were normalized with respect to the hybridization signal present 12 h after transfection of each transcript. Results are means calculated from triplicate hybridizations against different dilutions of the extracted total cellular RNA. Although there are sequential declines in the abundance of each RNA over time following transfection, the rate of decline in the abundance of HAV-Luc RNA differed from that of HAV-LucΔ3D as shown in panel B. (B) Shaded bars represent the abundance of HAV-Luc RNA relative to the abundance of HAV-LucΔ3D at various times following transfection. Values are normalized to the relative RNA abundance present 12 h after transfection of the transcripts, prior to any evidence of RNA replication. The line represents the relative abundance of the two RNAs in cells treated with 2 mM guanidine. Values are means calculated from duplicate or triplicate hybridizations against different dilutions of extracted total cellular RNA.

