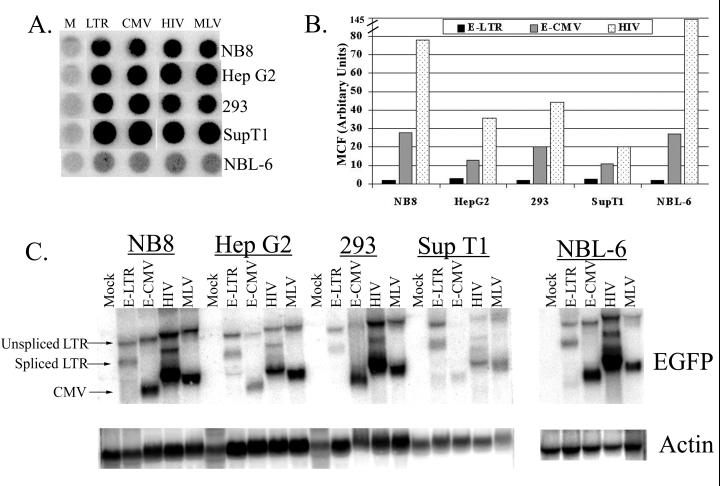
FIG. 1.
Analysis of gene expression from vector-transduced cells. Cells were transduced with the various vectors at an MOI of 0.5, expanded for 14 days, and sorted for EGFP expression. (A) Dot blot analysis of vector copies. DNA (30 μg) from the sorted EGFP cells (10 μg of DNA from NBL-6 cells) was spotted onto a nylon filter and probed with 32P-labeled EGFP cDNA. Lane M, mock-transduced. (B) Flow cytometric analysis of EGFP protein levels in sorted EGFP-positive cells transduced with the different vectors. Results are the mean levels of channel fluorescence (MCF) of EGFP-expressing cells and were normalized to the minimum gate setting. (C) Northern blot analysis of sorted EGFP-positive cells. Total RNAs were isolated from the sorted cells, and the blot was sequentially probed with 32P-labeled EGFP and β-actin. β-Actin was used to normalize for RNA loading. Arrows indicate the unspliced and spliced messages originating from viral LTRs and the transcripts originating from the internal CMV promoter. Mock, mock transduced. Data shown are representative of the gene expression levels observed from multiple experiments.

