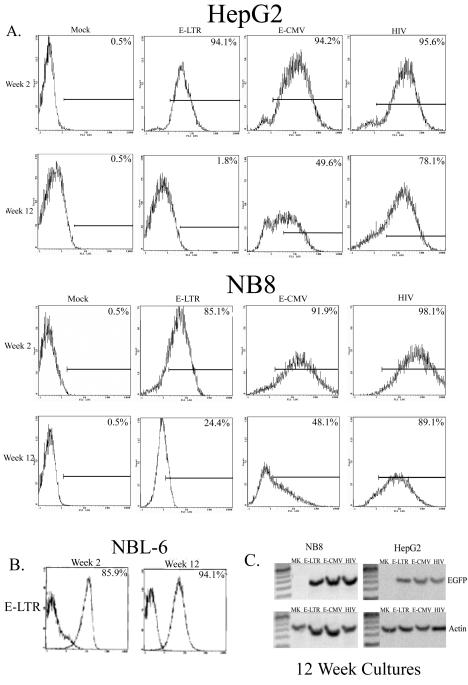
FIG. 3.
Long-term gene expression. Cells were transduced at an MOI of 0.5, expanded, and sorted for EGFP expression 14 days after transduction. The sorted cells were cultured, and the numbers of EGFP-positive cells were analyzed by flow cytometry 2 and 12 weeks later. The number of EGFP-positive cells is indicated in the corner of each histogram. (A) HepG2 and NB8 cells. Mock, mock transduced. (B) E-LTR-transduced NBL-6 horse fibroblast cells. (C) DNA-PCR analysis of EGFP levels in transduced cells. DNAs were isolated from HepG2- and NB8-transduced cells cultured for 12 weeks after transduction. Primers specific for EGFP (forward, 5′-CGAGCTGGACGGCGACGTAAAC-3′; reverse, 5′-GCGCTTCTCGTTGGGGTCTTTG-3′) or β-actin (forward, 5′-CATTGTGATGGACTCCGGAGACGG-3′; reverse, 5′-CATCTCCTGCTCGAAGTCTAGAGC-3′) were used to amplify 300 ng of DNA (30 cycles) from mock-transduced (lanes MK) or E-LTR-, E-CMV-, or HIV-transduced cells.

