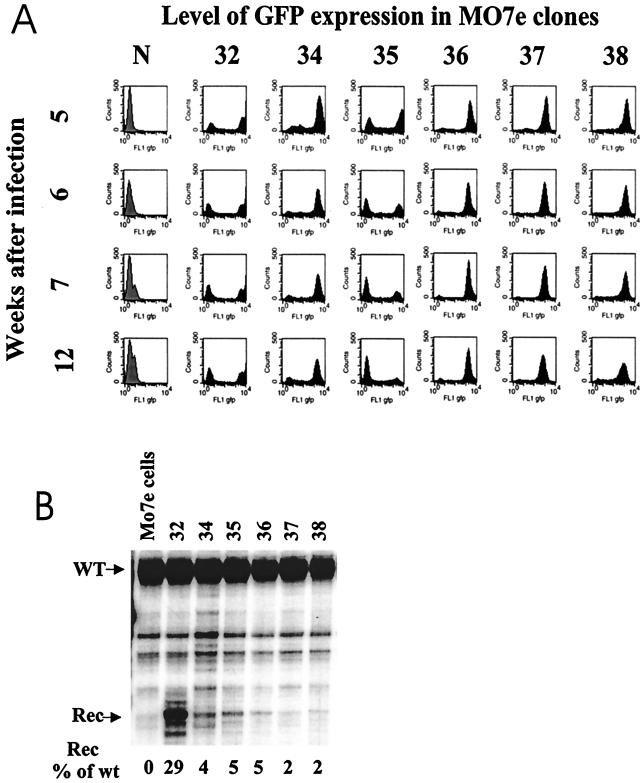
FIG. 5.
Stability of GFP expression (A) and γ-globin gene expression (B) over time. (A) GFP-positive fractions of individual MO7e clones were sorted 4 weeks postinfection. GFP-positive cells were plated, and the GFP expression profile was monitored by flow cytometry once a week for 12 weeks postinfection. The histograms show GFP expression in stable MO7e clones from week 5 to week 12. (B) RNase protection analysis of recombinant human γ-globin gene expression in GFP-positive MO7e clones 12 weeks postinfection. This assay allowed a direct comparison between the levels of γ-globin mRNA transcribed from ΔAd5/35.AAV (Rec) and wild-type human γ-globin mRNA (WT). Quantitation of globin gene expression levels was done by PhosphorImager analysis. The percentages of recombinant γ-globin compared to endogenous γ-globin expression are indicated below the corresponding lanes.

