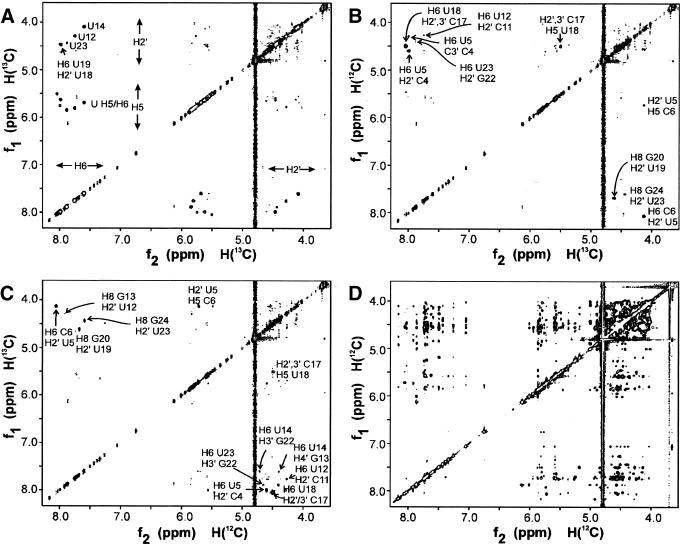
Figure 4.
X-filtering. 13C-filtered NOESY spectra of the 2H/13C/15N-U-labeled sample, demonstrating the spectral simplification and improved identification of NOE contacts achieved via this new labeling method, where specific deuteration is combined with specific 13C-labeling of crucial residue types. Because in the U residues only H2′ are left on the ribose, otherwise inaccessible NOEs can now specifically be assigned. Subspectrum (A) shows the NOE contacts between 13C-bound (f1) and 13C-bound (f2) protons, e.g. between uridine H2′ and H6 protons (either intra-residue or inter-residue). The intra-residue H6/8-H2′ of U12, U14 and U23 can be seen, because they are partially or completely S-puckered, in contrast to the other U residues (Table S2). In addition, an intense sequential contact is seen between H6 of U19 and H2′ of U18. Subspectrum (B) shows cross peaks between 12C-bound protons (f1) and 13C-bound protons (f2). In the H6/8 (f1)-H2′ (f2) region (below the diagonal), two intense cross peaks are seen. They are the sequential H6/8i-H2′i–1 of C6-U5 and G20-U19. The two weaker cross peaks are the sequential H6/8i-H2′i–1 of G13-U12 and G24-U23. In the H6/8 (f2)-H2′ (f1) region (above the diagonal), sequential cross peaks from H2′i–1 (f1) to H6/8i (f2) can be seen, i.e. from C4-U5, G13-U14, C17-U18 and, weakly, G22-U23. Subspectrum (C) shows cross peaks between 13C-bound protons (f1) and 12C-bound protons (f2). Subspectra C and B are symmetry-related, i.e. each cross peak in C appears in B on the opposite side of the diagonal. Subspectrum (D) shows the 12C-bound-to-12C-bound contacts, i.e. the NOE contacts between the non-U residues. Note the crowded H2′-H5′/5″ region.

