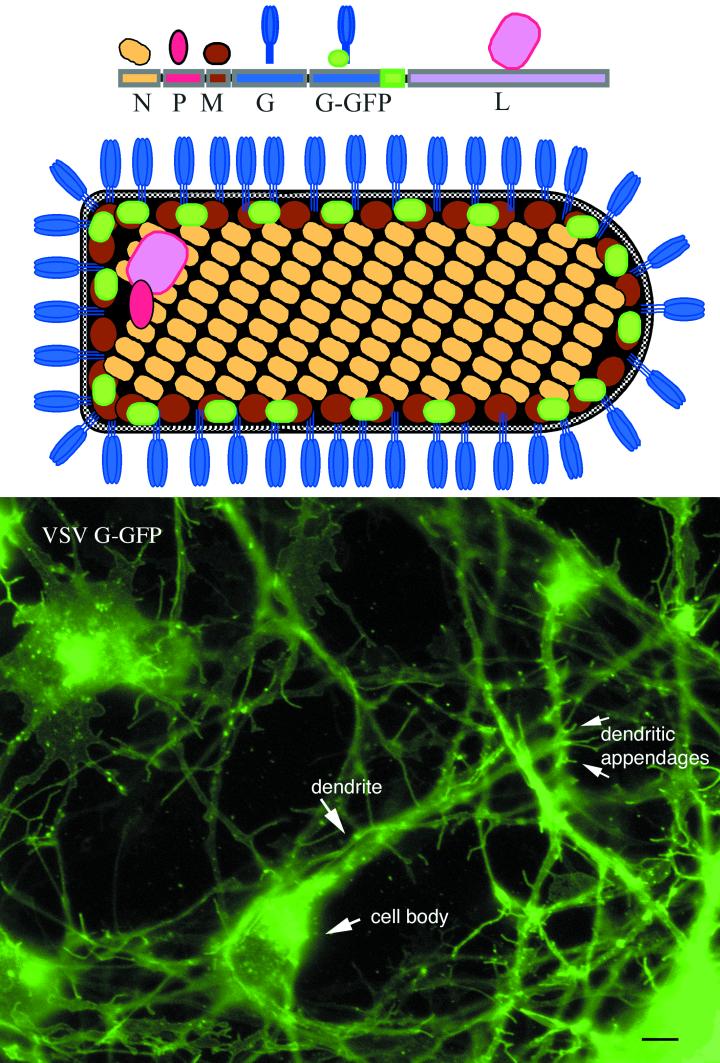
FIG. 7.
VSV G-GFP in plasma membrane. This color figure depicts the rVSV genes with the added G-GFP at the top, as well as a schematic of the rVSV showing where the GFP is situated within the recombinant virus in relation to the other viral proteins. The bottom shows a CNS culture after 2 days in vitro and infected 6 h prior to imaging. At this stage of infection, heterogeneity of expression of rVSV G-GFP is found among different cells. With time, the fluorescence of all cells will increase further. Bar, 6 μm.

