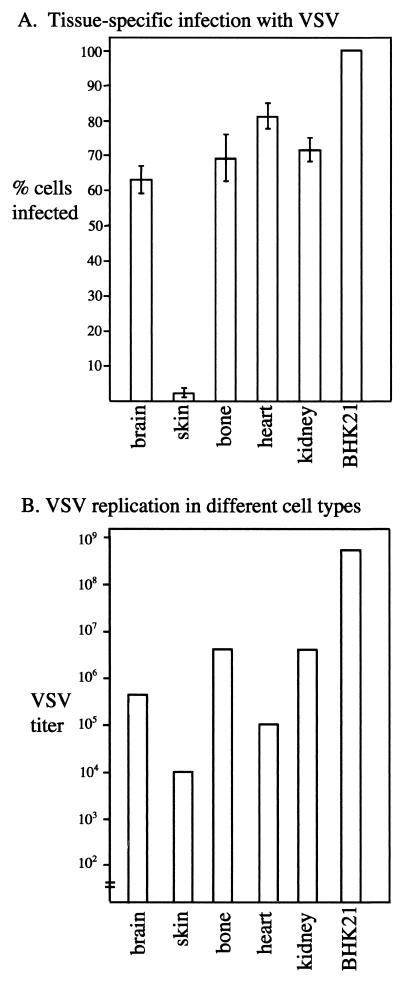
FIG. 9.
Bar graphs showing number of infected cells and VSV replication. (A) Tissue-specific infection with VSV. Based on the VSV infections shown in the preceding micrographs, the relative number of GFP cells (fluorescence) and total cells (DIC) was determined in eight microscope fields. Means and standard errors of the mean are shown in the top bar graph. (B) VSV replication in different cell types. To determine the rate of replication in the different cells, sister cultures were harvested (three cultures per cell type), and the viral titer was determined by incubating the culture medium with BHK-21 cells and determining the virus concentration by plaque assay. The mean level of viral replication is shown here.

