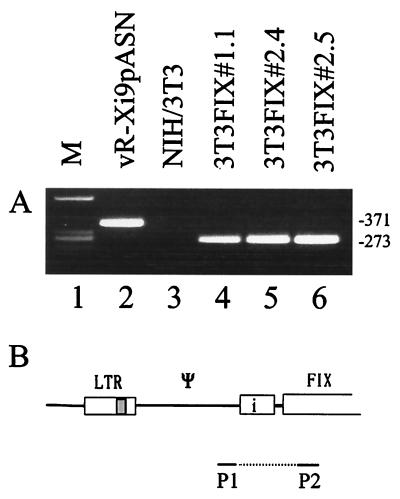
FIG. 4.
Analysis of the transcripts of the transduced cell clones and the vaccinia virus-infected cells by RT-PCR (A) and outline of the primers (P1-P2) and the template used (B). (A) Lane 1, size markers (M); lane 2, RNA of cells infected with the hybrid virus vR-Xi9pASN; lane 3, negative control RNA of NIH 3T3 cells; lanes 4 to 6, RNA of the transduced clones 3T3FIX#1.1, 3T3FIX#2.4, and 3T3FIX#2.5. The numbers on the right are the sizes of the bands in base pairs.

