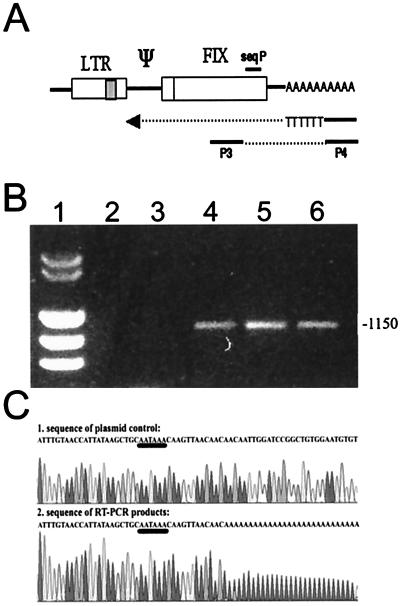
FIG. 8.
RT-PCR of transcripts terminating at the internal pA site and sequence analysis of cDNAs. (A) Schematic outline of the primers and the template used to map pA. (B) Agarose gel electrophoresis showing the results of the PCR analysis. Lane 1, size markers; lane 2, RNA of cells infected with the hybrid virus vR-Xi9pASN; lane 3, negative control RNA of NIH 3T3 cells; lanes 4 to 6, RNA of the transduced clones 3T3FIX#1.1, 3T3FIX#2.4, and 3T3FIX#2.5. The number on the right is the size of the bands in base pairs. (C) Sequence of plasmid control pR-Xi9pASN and the cDNAs derived from the internally terminated transcripts.

