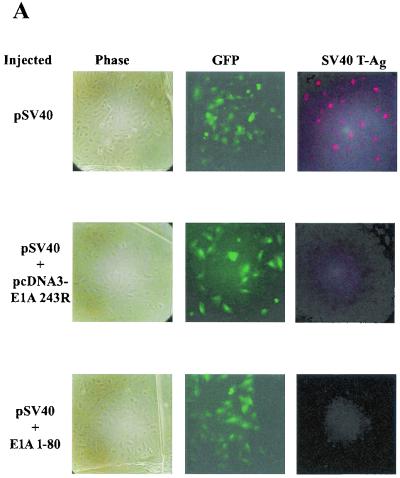
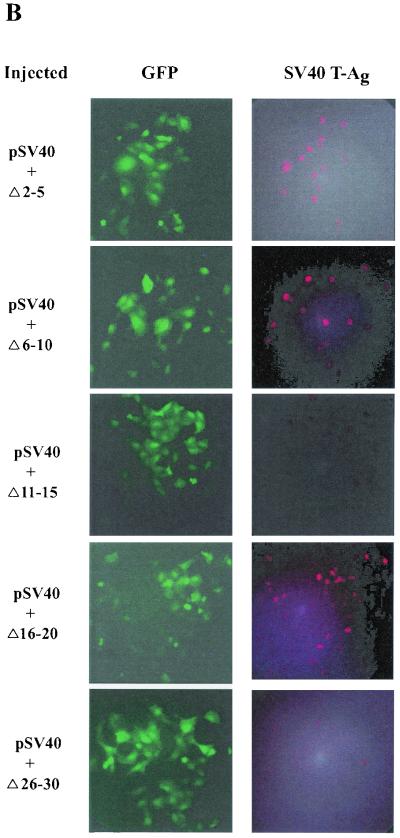
FIG. 3.
Two regions of E1A 1-80, amino acids 2 to 6 and amino acid 20, are critical for E1A repression in vivo. Each individual experiment involved the microinjection of about 100 cells, but only a portion of each microinjected area is seen in the representative photographic fields in these figures. (A) Representative cell microinjection assays demonstrating the transcriptional-repression function of E1A 243R and E1A 1-80. The photomicrographs in each row are of the same field of cells visualized under different conditions. The left column (Phase) is visualized under phase microscopy. The middle column (GFP) is visualized under fluorescence microscopy through an FITC transparent filter and shows cells expressing green fluorescent protein (GFP), a marker for successfully injected cells. The right column (SV40 T-Ag) is visualized under fluorescence microscopy through a rhodamine transparent filter and shows cells expressing SV40 T antigen. Cells in the first row were coinjected with 8 ng of pSV40/μl and 10 ng of pEGFPN-1/μl. About 75% of successfully injected cells were positive for SV40 T antigen. Cells in the second row were coinjected with pSV40, pEGFPN-1, and 10 ng of the E1A 243R-expressing plasmid pcDNA3-E1A 243R/μl. Cells in the third row were coinjected with pSV40, pEGFPN-1, and 25 ng of E1A 1-80 polypeptide/μl. (B) Representative microinjection assays demonstrating that E1A 1-80Δ2-5, E1A 1-80Δ6-10, and E1A 1-80Δ16-20 are defective in transcription repression function in vivo. Cells were coinjected with 8 ng of pSV40/μl, 10 ng of pEGFPN-1/μl, and 25 ng of the indicated E1A 1-80 deletion mutant/μl. (C) Representative assays demonstrating that E1A 1-80 2Ala, 3Ala, 4Ala, 5Ala, and 6Ala are defective to various degrees in transcription repression function in vivo. Cells were injected as described for panel B above except that 25 ng of the indicated Ala substitution mutant/μl was injected. (D) Representative assays demonstrating that E1A 1-80 20Ala is defective in transcription repression function in vivo. Cells were injected as described for panel B above. It should be noted that for E1A 1-80 20Ala, the field shown has fewer cells than fields coinjected with other mutants. E1A 1-80 20 Ala is nonetheless clearly defective: 17 cells were positive for T antigen of 21 cells injected, representing 80% of successfully injected cells visualized in this field.


