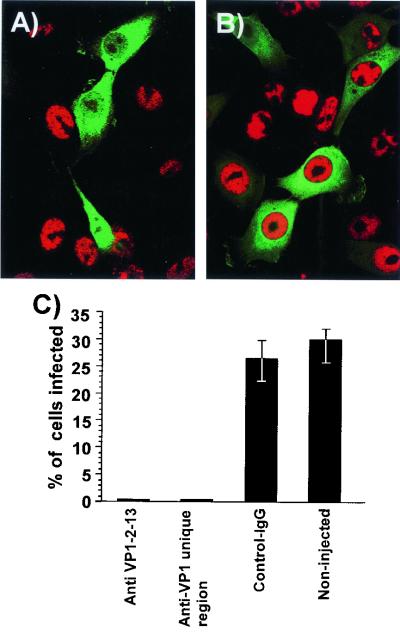
FIG. 4.
Effect of injection with anti-VP1-2-13 or rabbit IgG against the complete VP1 unique region on infection of the cells by CPV. (A and B) Injection of anti-VP1-2-13 antibody (A) or control mouse IgG (B). The cells were costained for IgG (FITC, green) and for viral NS1 protein (red). (C) Percentage of cells that became infected after injection with anti-VP1-2-13, with the rabbit anti-VP1 unique region, or with control IgG or without injection in the same cultures. Error bars indicate standard deviations.

