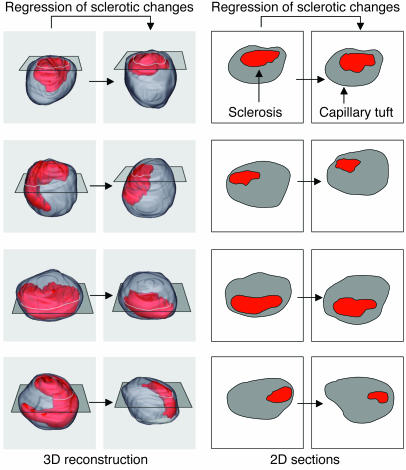
Figure 4.
3D versus 2D estimation of hypothetical regression of glomerulosclerosis changes. Simulation of sclerotic changes reduction in 3D glomerular capillary tuft reconstructions (left) and corresponding 2D estimation of changes in sclerosis extension in single section morphology (right). The outer surface of the glomerular capillary tuft is represented in gray, while sclerotic changes are represented in red. Hypothetical reductions of sclerosis changes (left to right) represented in 3D images are less evident in corresponding single sections of the same glomerular tuft. The technique for 3D reconstruction of glomerulosclerosis changes is reported in detail in ref. 108.

