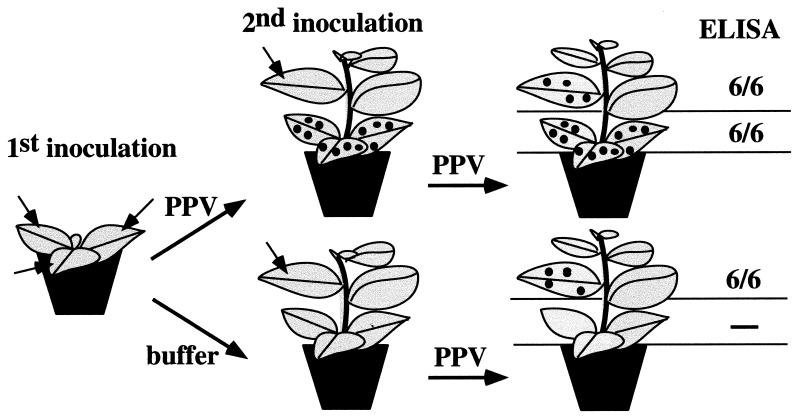
FIG. 6.
Susceptibility of tobacco to PPV reinoculation after a first local infection. The figure shows a schematic representation of the procedure used in the experiment. PPV was inoculated on upper healthy leaves of plants that had been previously infected with PPV (top row) or mock inoculated (bottom row). The column on the right shows the number of plants accumulating virus, assessed by ELISA, in the leaves inoculated in each of the challenges relative to the total number of inoculated plants.

