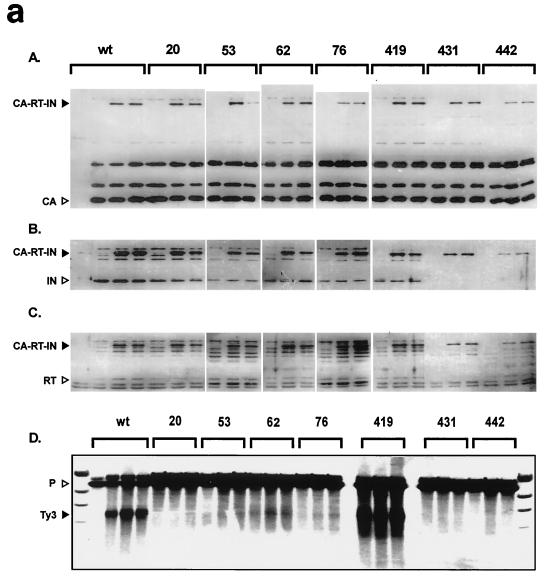
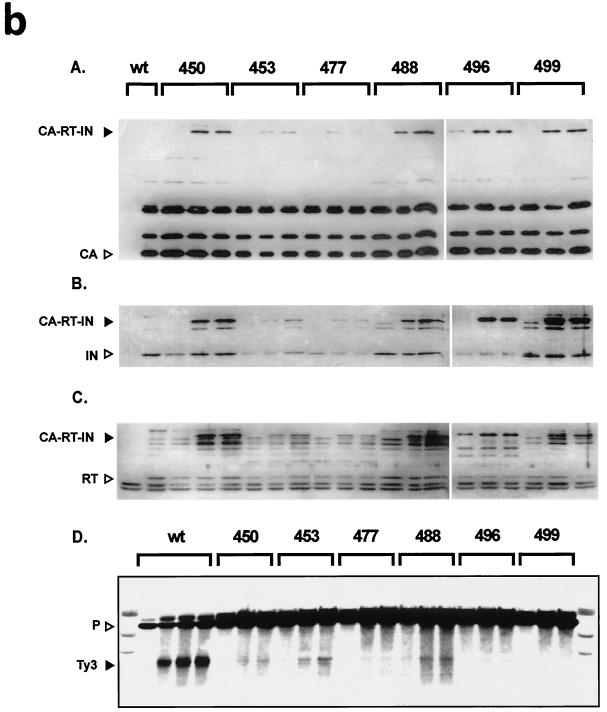
FIG. 7.
(a and b) Immunoblot analysis of cells expressing Ty3 IN mutants together with CA-RT-IN and CA-RT-IN(cat−) fusion proteins. (A) Immunoblot analysis using α-CA IgG. (B) Immunoblot analysis using α-IN IgG. (C) Immunoblot analysis using α-RT serum. Fractionation and blotting procedures were as described in the legend to Fig. 6, except that 5 μg of whole-cell extract was used. (D) Southern blot analysis using a Ty3-specific probe as described for Fig. 6, except that 100 μg of total nucleic acid was used per lane, except in the case of the sample from wild-type cells, in which only 20 μg was used. In panels A to D, sample sets represent cells expressing Ty3 plus vector, CA-RT-IN, and CA-RT-IN(cat−) (left to right).


