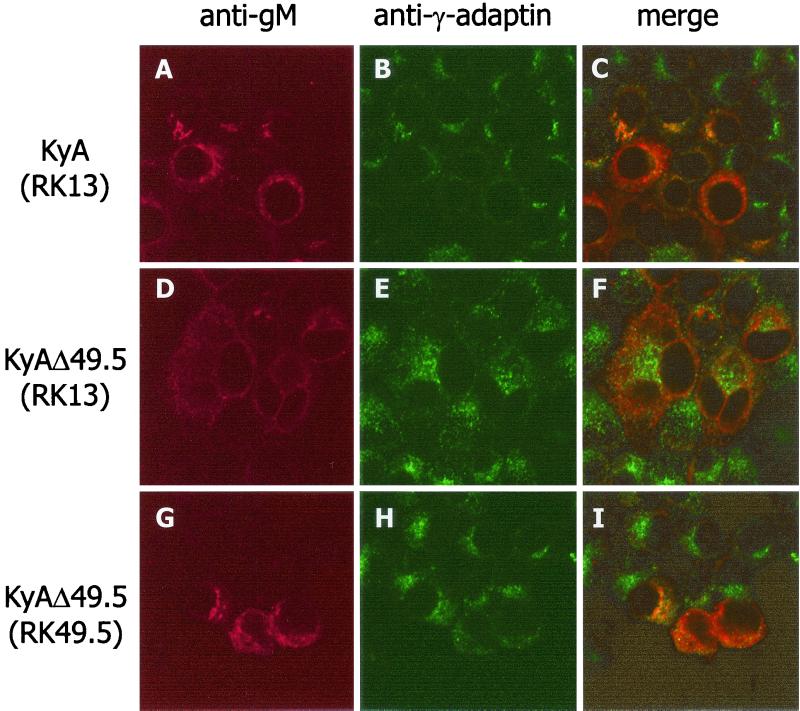
FIG. 4.
Confocal laser scanning microscopy of RK13 (A to F) or RK49.5 (G to I) cells infected with KyA (A to C) or KyAΔ49.5 (D to I). gM was detected with MAb P18/A8 and visualized with anti-mouse IgG1-Cy3 conjugate (A, D, and G), and TGN vesicles were stained with γ-adaptin MAb followed by anti-mouse IgG2b-fluorescein isothiocyanate antibody (B, E, and H). Merges of the signals recorded separately for each channel (green, 505 to 530 nm; red, >585 nm) are shown in panels C, F, and I. The yellow color in C and G indicates colocalization of gM and γ-adaptin signals. Panels represent views of 60 by 60 μm.

