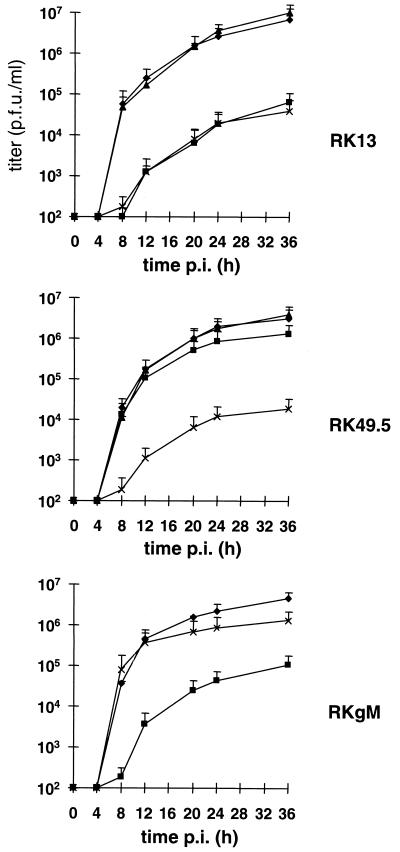
FIG. 6.
Single-step growth kinetics of KyA (⧫), KyAΔ49.5 (▪), KyAΔ49.5R (▴), and KyAΔgM (×) on RK13, RK49.5, or RKgM cells. At the indicated times p.i., virus titers were determined on RK13 cells as described in Materials and Methods. Shown are means and standard deviations from three independent experiments.

