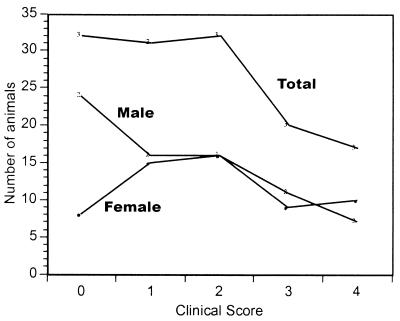
FIG. 3.
Disease incidence and severity in mapped F2 population. One hundred and thirty-two F2 mice were infected with HSV and examined on day 6 after infection for clinical symptoms as described in the legend to Fig. 2. The data presented are the number of mice at each level of clinical disease achieved. The three populations presented in this graph are the total population, the female group in the total population, and the male group in the total population.

