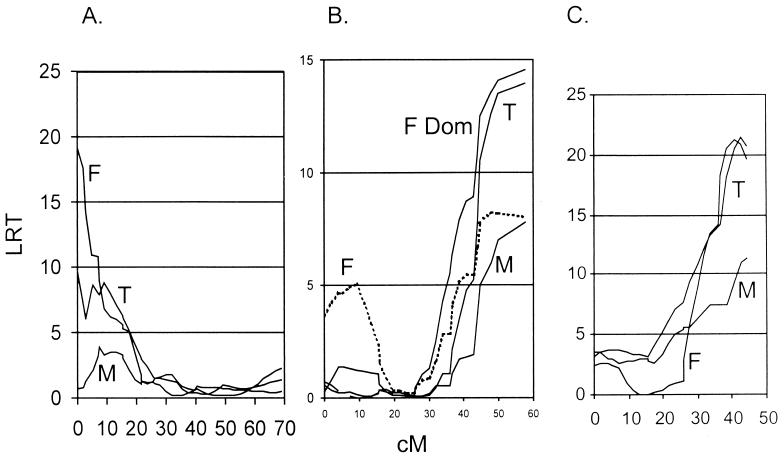
FIG. 4.
Intervals for HSK loci. Interval maps for the trait of HSK clinical disease show significant linkages on chromosome 12 (both sexes) (B), chromosome 5 (significant in females only) (A), and chromosome 14 (females only) (C). T, total; F, female; M, male. The QTL shown are calculated with free regression statistics except for chromosome 12 in females, where the dominant inheritance pattern (F Dom) is also depicted. In all three of the intervals shown, a down slope on both sides of the peaks could not be shown; thus, end effects need to be considered.

